
Home › Case studies › Case study library
GSA Search Console Then and Now: An Honest Report
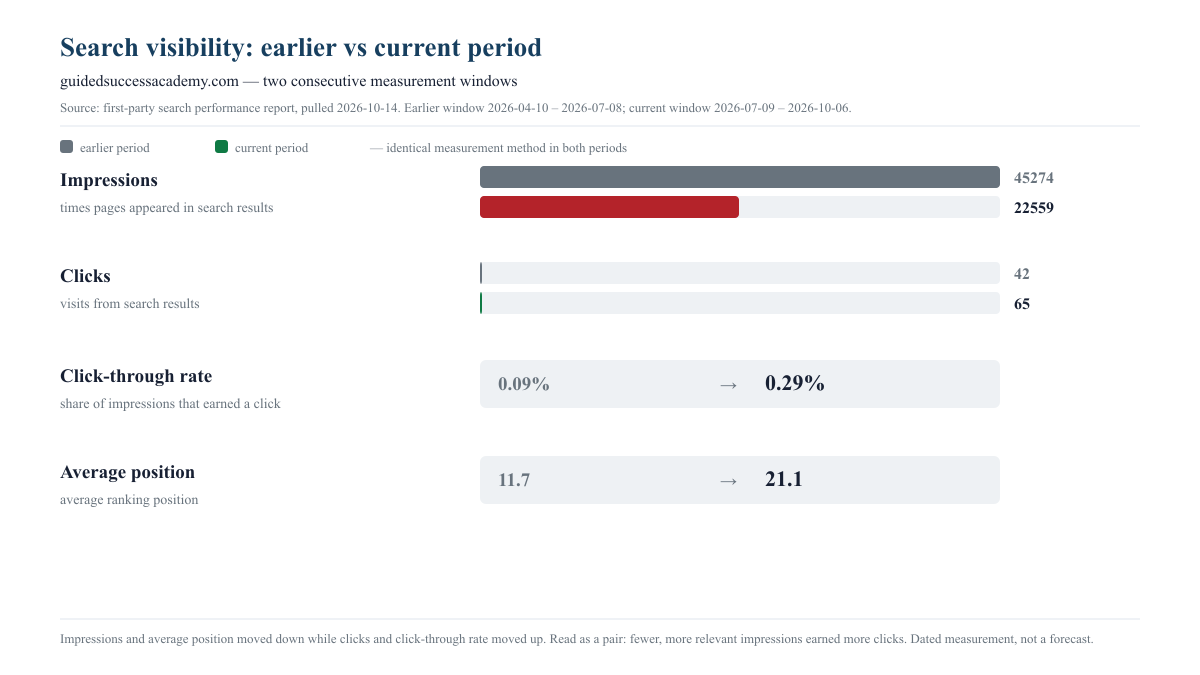
Across two adjacent 90-day Search Console windows, clicks rose from 42 to 65 and CTR roughly tripled, while impressions fell from 45,274 to 22,559 and average position weakened from 11.7 to 21.1. The headline reads like a decline. The page-level data says something more specific: 156 of 201 tracked pages gained impressions, and a single comparison page accounts for more than the entire net drop.
Business Context
Guided Success Academy is a small, operator-run site with a broad content inventory: service pages, audit tools, local SEO material, and a large body of consumer and comparison articles. That mix matters. Aggregate Search Console numbers on a site like this are a weighted average over very different kinds of pages, and a single high-volume page can move the sitewide line on its own. The site had also changed materially in 2026 — domain and information architecture work was completed — so the two windows below are not a controlled experiment. They are two dated photographs of the same property at different stages.
The Challenge
The honest version of this report could not simply say ‘traffic is down’ or ‘traffic is up’. It had to answer three separate questions that a single trend arrow hides: did the site lose visibility, did it lose selection, and did any of that reach a business action? Those are different measurements. Impressions describe how often the site appeared in search results. Clicks describe how often a searcher chose it. CTR describes the ratio between the two. Average position describes where the site typically sat when it did appear. The challenge was to keep all four in view at once, and then to find out whether the movement was broad or concentrated — because a broad decline and a single-page decline call for completely different responses.
What Was in Scope
- Two adjacent complete 90-day Search Console windows on the same verified property
- Impressions, clicks, CTR, and average position at sitewide level
- Page-level movement across all 201 URLs that returned data in either window
- Query-level attribution for the pages that moved most
- Historical context for the 2026 domain and architecture changes
- An explicit statement of what these windows cannot prove
Before and After at a Glance
A plain-language view of what was measured, what it looked like before, and what it looks like now. Each change is labelled so a score is never read on its own.
| The issue | Before | After |
|---|---|---|
| How often the site appeared in searchVisibility fell by half, but one page accounts for most of it. | 45,274 | ▼ Lower22,559GSA Search Console |
| People who actually clicked throughMore selected visits in a smaller impression base. | 42 | ▲ Improved65GSA Search Console |
| How often a view becomes a clickTripled, partly because low-CTR volume left the base. | 0.09% | ▲ Improved0.29%GSA Search Console |
| Typical ranking position in searchMoved from page one to page three on average. | 11.7 | ▼ Lower21.1GSA Search Console |
These are dated lab measurements, not a universal visitor experience. Read each row with its source and the limitations at the end of this report.
Evidence and Baseline
Both windows come from the same first-party Google Search Console property (sc-domain:guidedsuccessacademy.com), read with read-only access on 2026-10-14. The earlier window is 2026-04-10 to 2026-07-08; the later window is 2026-07-09 to 2026-10-06. The two windows are contiguous, so together they cover the six months from April to October 2026. Page-level and query-level detail is drawn from the same API at the same time, so the sitewide totals and the page rows reconcile exactly. No data in this report is modelled, estimated, or extrapolated.
Timeline
- Historical context The domain, architecture, and published inventory changed materially during 2026, which is why the two windows are treated as context rather than as an experiment.
- Measurement Two adjacent 90-day windows were pulled from the same verified Search Console property on 2026-10-14, at sitewide, page, and query level.
- Attribution Page-level movement showed the impression decline was concentrated in the comparison cluster rather than spread across the site.
- Reporting plan Search exposure was separated from business outcomes, and a matched-window, page-level standard was set for the next cycle.
The sitewide numbers, stated plainly
In the earlier window, 2026-04-10 to 2026-07-08, the property recorded 45,274 impressions, 42 clicks, a CTR of 0.09%, and an average position of 11.7. In the later window, 2026-07-09 to 2026-10-06, it recorded 22,559 impressions, 65 clicks, a CTR of 0.29%, and an average position of 21.1.
Read as a summary, that is a confusing result. Impressions fell by 22,715, which is a 50% reduction. Clicks rose by 23, which is a 55% increase. CTR tripled. Average position weakened from 11.7 to 21.1, meaning the site’s typical appearance moved from near the bottom of page one to the top of page three. Two of those movements are encouraging and two are not, and they are not measuring the same thing.
The temptation at this point is to pick the flattering number and build a story around it. The more useful move is to stop averaging and look at the individual pages, because on a site with this much content, the sitewide average is mostly a description of whichever page happens to be largest.
The single finding that explains most of the drop
One URL, /semrush-vs-ahrefs-2026/, recorded 15,265 impressions in the earlier window and 1,588 in the later window. That is a loss of 13,677 impressions on a single page, which is 60% of the entire sitewide impression drop of 22,715.
The page did not merely lose impressions. It lost position. Its average position moved from 7.9 to 14.3, crossing out of the top ten and into the second page of results. Its clicks in the same period went from 5 to 0. For a comparison article, position is close to everything: a reader comparing two SEO tools is at the decision end of the funnel, and decision-stage queries rarely survive a page-two placement.
Query-level data shows what happened underneath that number. In the earlier window the page appeared for ‘semrush vs ahrefs 2026’ at position 5.0 and for ‘ahrefs vs semrush 2026 comparison’ at position 9.7. In the later window it returned no rows at all for either query.
This is the difference between a site that is declining and a site that is carrying the weight of one page that moved. The distinction is not cosmetic. If the sitewide line were driven by many pages drifting down, the correct response would be a broad technical and content review. Because the line is driven mainly by one page leaving the top ten, the correct response is specific: examine that page’s intent, its freshness against a fast-moving software comparison category, and whether another URL on the site should own that query instead.
What the aggregate was hiding
Across both windows, 201 URLs returned data. Of those, 156 gained impressions and 45 lost them. Put another way, roughly four out of five tracked pages improved their impression count in the later window. The net sitewide decline is what you get when one page loses 13,677 impressions and 155 others add small amounts that do not sum to the same figure.
The second-largest impression loss on the site was /dropshipping-vs-private-label/, which moved from 3,921 to 728 impressions. The third was /shopify-vs-woocommerce-2026/, from 2,461 to 134. Both are comparison articles, and both follow the same pattern as the hero page: they lost visibility and position together, which is consistent with the comparison category becoming more competitive rather than with a sitewide technical fault.
At the same time, the site’s clearest winner was /best-standing-desk-for-home-office/. Its average position improved from 29.1 to 14.5 and its clicks rose from 4 to 17 — more than a fourfold increase in selected visits. That page carried 2,712 impressions in the later window with a CTR of 0.63%, against 3,592 impressions and a CTR of 0.11% in the earlier window. Fewer appearances, far more clicks: the page moved up and started getting chosen.
A sitewide report that only showed the impression line would have recorded that page as a decline, because its impressions also fell. It would have missed the actual improvement entirely.
Clicks and position moved in opposite directions
The site earned 42 clicks in the earlier window and 65 in the later one, while average position weakened from 11.7 to 21.1. Those two facts sit together without contradiction once selection is separated from exposure.
The homepage illustrates the pattern, if not the cause. It held 245 impressions and 8 clicks at position 8.6 in the earlier window, then 288 impressions and 12 clicks at position 32.8 in the later one. Its CTR rose from 3.27% to 4.17% even as its average position weakened sharply. That combination is what a branded or navigational query looks like: people who already know the site find it and click it regardless of rank, while the broader, non-branded queries that used to place it on page one no longer do.
The sitewide CTR movement tells the same story. CTR roughly tripled, from 0.09% to 0.29%. That is a large relative change, and it would be easy to present as a win. It is better read as a composition change: when a very high-volume, low-CTR page loses its impressions, the remaining impression base is made up of pages with naturally higher CTR, so the sitewide ratio improves without any individual page becoming more compelling. CTR is a ratio, and a ratio can rise because the denominator shrank.
What we are doing next, and why
The specific finding points to a specific action. The comparison cluster — /semrush-vs-ahrefs-2026/, /shopify-vs-woocommerce-2026/, /dropshipping-vs-private-label/ — needs a decision per page rather than a sitewide intervention. For each one, the question is whether it can be refreshed and repositioned, consolidated into a stronger page, or left to run without further investment. That is an editorial and intent question, not a technical one.
On the same evidence, the next reporting cycle should keep the two windows matched at 90 days and adjacent, because a window pair that changes length between reports makes the comparison meaningless. The page-level detail should be part of every report, not an optional appendix, because the sitewide figure in this case actively misled: it is only when you look at the 201 rows that the story becomes legible.
The one thing this report will not do is credit the movement to a single change. The domain and architecture work in 2026 overlapped with the earlier window, the comparison category is competitive and volatile, and no controlled conditions existed at any point. The honest position is that we can describe exactly what moved and approximately where, and that we cannot attribute it to one cause.
What these windows cannot tell you
Search Console measures search exposure and selection. It does not measure enquiries, purchases, or revenue, and nothing in this report should be read as a commercial result. A click is not a customer.
These two windows are not a controlled experiment. The property changed during the period, the content inventory changed, and the competitive landscape in the software-comparison category moved independently of anything done on the site. Any statement of the form ‘X caused Y’ would be unsupported by this data.
Average position is an average across every query a URL appeared for, weighted by impressions. It is sensitive to which long-tail queries happen to be included in a window, and it can move without any change in how a page ranks for its main terms. It is a directional indicator, not a rank tracker.
Finally, the comparison cluster’s decline is measured but not explained. This report can show that the pages lost position and clicks. It cannot yet show whether the cause was a competitor’s content, an algorithmic reassessment of the category, changes to the pages themselves, or something else. That question is open on the record.
What Improved
- The report separates a real, sitewide signal from a single-page event instead of averaging them together.
- It identifies one page whose recovery or retirement would materially change the sitewide trend.
- It records a genuine win — /best-standing-desk-for-home-office/ moving from position 29.1 to 14.5 — that the aggregate figure had hidden.
- It sets a matched-window standard for the next report so future comparisons stay meaningful.
- It keeps the search data separate from commercial claims, which is the boundary that makes the numbers usable.
What Remains Unresolved
- The domain and information architecture changed during the measured period, so the windows are not a controlled experiment.
- No single page edit can be credited with the movement from these windows alone.
- The cause of the comparison-cluster decline is measured but not explained.
- Average position is impression-weighted and sensitive to query composition, so it is directional rather than a rank tracker.
- Business outcomes require reliable analytics, event, enquiry, and purchase tracking, which this report does not include.
Evidence Images
No separate before screenshot exists. Both windows in this report come from the same dated read, so the comparison chart carries the full evidence and no reconstructed image has been substituted.
Next Decision
Decide, page by page, whether the comparison cluster should be refreshed, consolidated, or allowed to run — and adopt a matched 90-day window with page-level detail as the standing reporting standard.
- GSA Search Console, sitewide totals, both windows first-party Search Console read (read-only); 2026-10-14
- GSA Search Console, page-level movement across 201 URLs first-party Search Console read (read-only); 2026-10-14
- GSA Search Console, query-level movement for the comparison cluster first-party Search Console read (read-only); 2026-10-14
Case study library | GSA case studies | The Revenue-Leak Audit
See which pages lose clicks
Run the free website SEO audit to find the pages Google already shows but that earn almost no clicks, then fix the highest-impact issues first.