
SEO case studies — our own site, numbers unedited
We run our own SEO playbook on Guided Success Academy before we sell it. These case studies show our real Search Console data — including the leaks we haven’t fixed yet. No invented client results, no “we grew traffic 400%” screenshots.
Google Search Console · 18,747 impressions in latest complete 90 days · updated monthly
Why On-Page SEO Matters to Business Results
Search visibility is not the same as business value. The useful path is impression → click → relevant page experience → enquiry or purchase. On-page SEO can improve the parts of that path the site owner controls, but it cannot guarantee rankings, traffic, sales, or revenue.
Then and now: GSA Search Console evidence
Important context: GSA’s domain, information architecture, and page inventory changed materially after March 2026. This comparison is directional context, not a controlled experiment and not proof that on-page SEO alone caused the movement.
Then: The published GSA baseline recorded 15,668 impressions, 42 clicks, 0.27% CTR, and average position 16.2.
Now: In the latest complete 90-day window, 2026-07-06 to 2026-10-03, GSC records 20,776 impressions, 60 clicks, 0.29% CTR, and average position 19.5.
| Metric | Earlier snapshot | Latest 90 days | Change vs previous 90 days |
|---|---|---|---|
| Impressions | 46,374 | 20,776 | -25598 (-55.2%) |
| Clicks | 42 | 60 | +18 (+42.9%) |
| CTR | 0.09% | 0.29% | +0.20 percentage points |
| Average position | 11.6 | 19.5 | +7.9; lower is better |
What this proves: It shows the gap between being seen and being chosen. It does not prove that one on-page change caused a sales result. The page, offer, trust signals, conversion flow, demand, and follow-up still matter.
Read the unedited GSA case studies, including the content-leak audit and GSC audit.
Illustrative funnel math, not a forecast
At 10,000 impressions, a 0.30% CTR produces 30 visits while a 1.20% CTR produces 120 visits. At a 3% conversion rate, that is 0.9 versus 3.6 enquiries. The calculation explains why CTR and intent deserve attention; it is not a promise that a page will reach either rate.
After an on-page fix, measure impressions, clicks, CTR, average position, engaged sessions, audit starts, enquiries, and purchases. The content refresh service describes the implementation and before/after reporting process; the SEO audit checklist is the DIY companion.
Latest numbers (90 days)
Read plainly: Google shows us 20,776 times for real searches, but only 60 people click. Our own bottleneck is exactly the one we diagnose for clients — impressions without clicks. That is the honest starting point.
Observed reason for the visibility drop
The largest observed loss came from URL ownership changing around the Ahrefs/Semrush comparison. The previous URL /semrush-vs-ahrefs-2026/ recorded 16,004 impressions in the earlier window, but it now redirects to the canonical /ahrefs-vs-semrush-2026/ path. The canonical change was compounded by 22 published internal links that still pointed to the old URL. Those links have now been corrected.
| Signal | What we observed | How to read it |
|---|---|---|
| Old URL | 16,004 earlier impressions; 1,736 in the latest window | Visibility did not disappear cleanly; Google is still reconciling URL ownership. |
| Canonical URL | Separate current visibility is still limited | Internal links now point to the canonical path; recrawl and consolidation are still required. |
| Sitewide result | Clicks rose while impressions fell | This is a visibility and URL-mix problem, not proof of a sitewide penalty or algorithm cause. |
Next verification: Recheck both URLs after the next complete crawl window. Do not claim that the repair restored rankings until Search Console shows the canonical URL receiving the relevant queries and impressions.
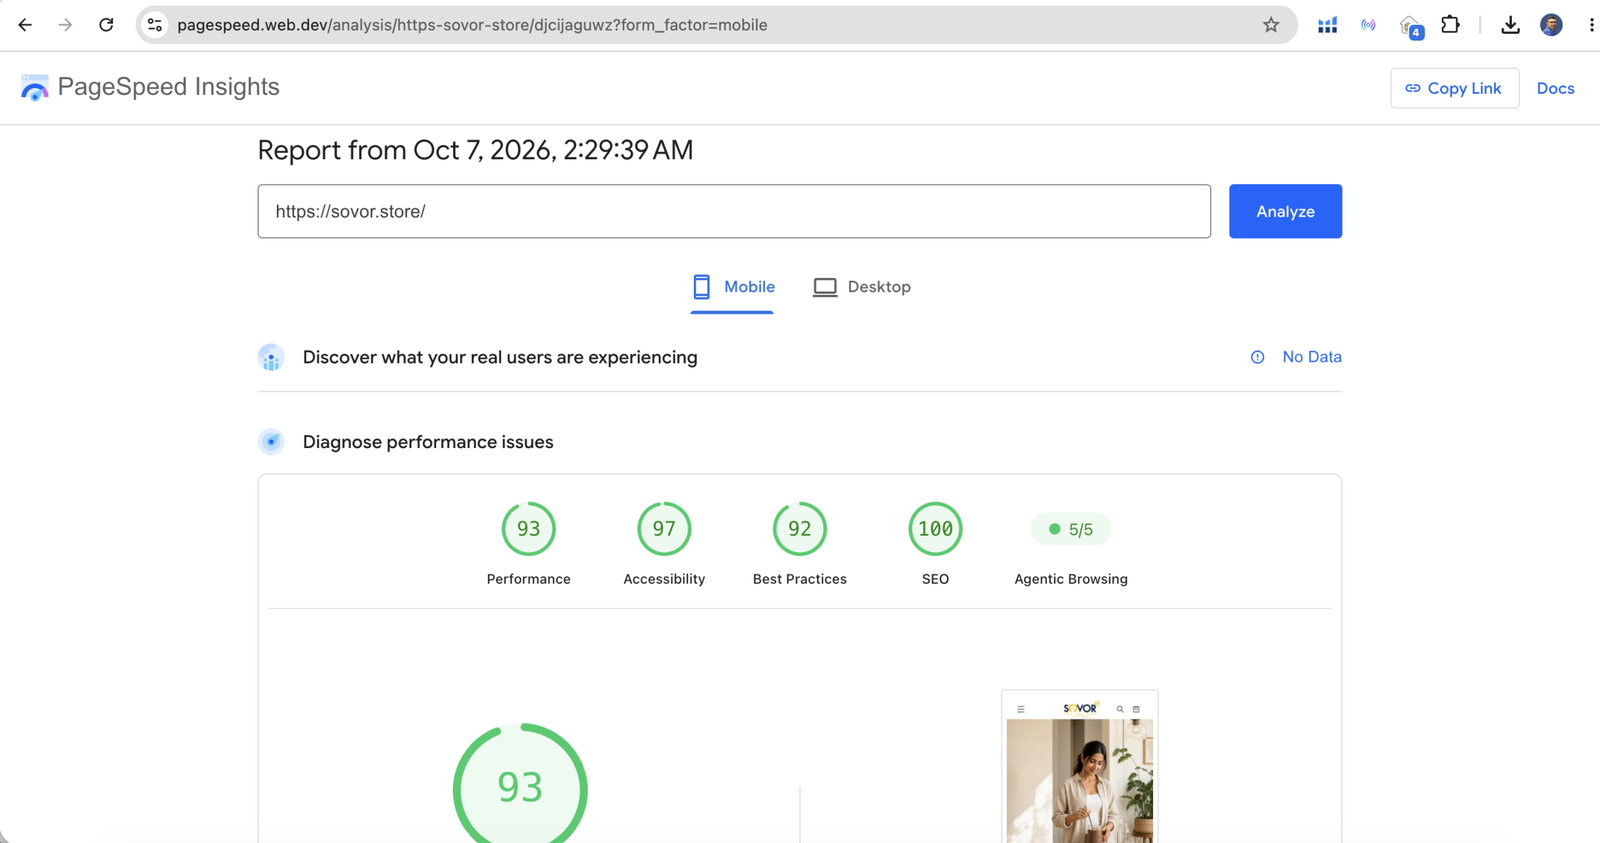
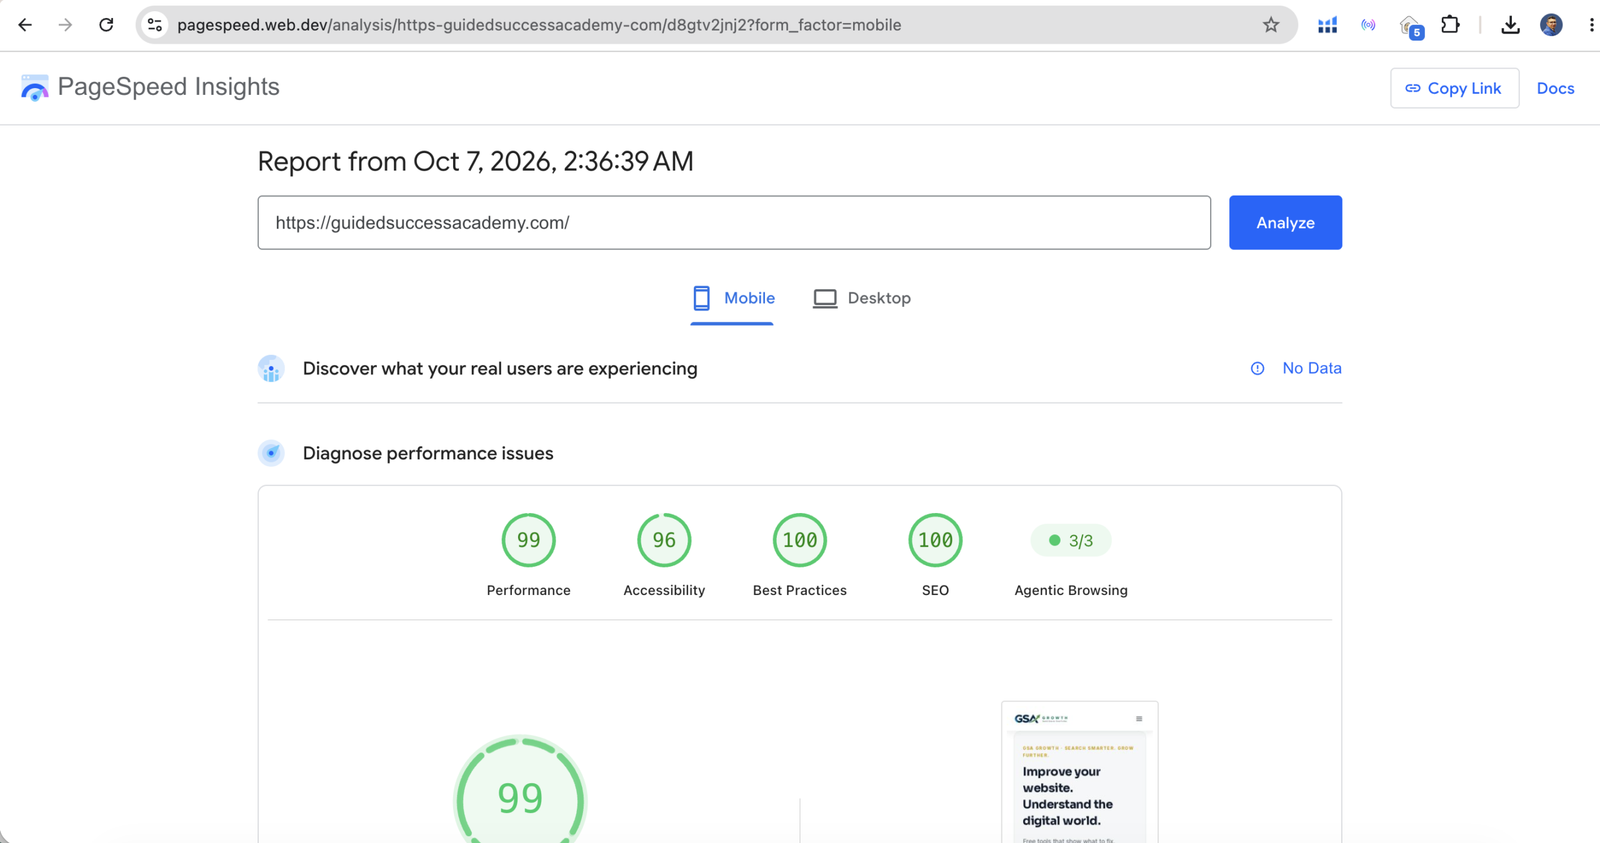
Latest PageSpeed reports: 7 October 2026
These are dated Lighthouse lab measurements for two separate properties. The screenshots below are the requested mobile reports; the comparison table also records the latest multi-category PageSpeed API recheck. Scores can vary between runs, so the screenshot and API observations remain labelled separately. Field or CrUX data was unavailable.
| Property | Device | Performance | Accessibility | Best Practices | SEO | FCP | LCP | CLS |
|---|---|---|---|---|---|---|---|---|
| SOVOR | Mobile API recheck | 94 | 97 | 92 | 100 | 1.9s | 2.9s | 0.000 |
| SOVOR | Desktop API recheck | 100 | 97 | 92 | 100 | 0.5s | 0.7s | 0.007 |
| GSA | Mobile API recheck | 98 | 96 | 100 | 100 | 1.3s | 1.9s | 0.043 |
| GSA | Desktop API recheck | 99 | 96 | 100 | 100 | 0.4s | 0.6s | 0.004 |
The case studies
The content leak
4,841 impressions across 4 pages earning under 1% CTR — a full walk-through of how we found them and what we’re fixing.
Reading your Search Console
The 20,776-impression picture, the one metric that matters, and how to turn GSC from noise into a ranked fix list.
Why we publish our own weak numbers
Any agency can claim results. Showing our real CTR, our page-2 rankings and the pages we still need to fix is the only honest version of a case study. It also proves the method works in both directions: we know exactly where our own traffic leaks, and we fix it in public — the same discipline we bring to a client’s site.
What we do not do: invent client logos, screenshot traffic charts, or promise rankings. The process guarantee is the product.