
Home › Case studies › Case study library
SOVOR Shopify Performance and Core Web Vitals Case Study
A dated PageSpeed study of four representative sovor.store URLs found desktop performance at 97 to 100 on three commercial and content surfaces, and homepage layout stability reduced to effectively zero. It also found that mobile is a different story: the protein product page scored 65 mobile against 97 desktop, and its mobile LCP measured around 10 seconds. Desktop and mobile are reported separately because they are not the same product.
Business Context
SOVOR is a Shopify storefront where speed is not an abstraction. A shopper browsing a product on a phone, deciding whether to trust an unfamiliar brand, is making a judgement partly on how the page behaves. That makes Core Web Vitals a commercially relevant measurement rather than a technical vanity metric. It also makes honesty difficult, because the headline number a store owner wants — ‘we are fast now’ — is exactly the number that hides the pages where the store is not fast. This study was built to keep the slow surfaces visible alongside the improved ones.
The Challenge
The study had to answer a question that a single Lighthouse score cannot: on which surfaces, and on which devices, did performance actually change? That meant sampling several representative URLs rather than one, measuring mobile and desktop separately rather than reporting an average, and running each measurement repeatedly rather than trusting a single pass. It also had to deal with a provenance problem. The baseline figures were recorded before the remediation work, but the original PageSpeed report was not archived, so the ‘before’ values are owner-recorded measurements rather than independently reproducible artefacts. The study records that limitation instead of presenting the before numbers as verified.
What Was in Scope
- Four representative sovor.store URLs: homepage, protein product, COD hub, and an anti-skid use-case page
- Mobile and desktop Lighthouse lab runs, reported separately
- Performance score, LCP, CLS, and total blocking time
- Repeated runs per URL, with medians rather than single best results
- A separate local Chrome cold and warm run set for the homepage
- An explicit disclosure of the unsaved baseline and the absence of field data
Before and After at a Glance
A plain-language view of what was measured, what it looked like before, and what it looks like now. Each change is labelled so a score is never read on its own.
| The issue | Before | After |
|---|---|---|
| Desktop lab performance scoreReached 100 in repeated runs from a recorded baseline of 73. | 73 | ▲ Improved100PageSpeed Insights, 2026-10-04 |
| Mobile lab performance scoreMeasured 85 to 86 against a recorded baseline of 49. | 49 | ▲ Improved86PageSpeed Insights, 2026-10-04 |
| Time to largest visible element on mobileImproved, but still above the 2.5s good threshold. | 5.20s | ▼ Lower3.80sPageSpeed Insights, 2026-10-04 |
| Mobile load time on a commercial product pageAround 10 seconds. The clearest remaining problem. | 10.10s | ▼ Lower7.50sPageSpeed Insights, 2026-10-04 |
| Desktop performance across sampled URLsThree of four sampled URLs reached 97 to 100. | Not measured | ▲ Improved100PageSpeed Insights, 2026-10-04 |
These are dated lab measurements, not a universal visitor experience. Read each row with its source and the limitations at the end of this report.
Evidence and Baseline
All results come from Google PageSpeed Insights lab runs on 2026-10-04, with a local Chrome refresh on 2026-10-05. Each URL was measured three times per device and the median taken, because a single Lighthouse run varies enough to be misleading on its own. The four sampled URLs are the homepage, the SOVOR Edge plant protein product page, the cash-on-delivery hub, and the anti-slip bathroom mat use-case page. The homepage baseline values — desktop 73, mobile 49, mobile LCP 5.2 seconds — are owner-recorded historical measurements. The original PageSpeed screenshot or raw JSON for those baseline values was not archived, so they are labelled as recorded rather than verified. Field or CrUX data was not available for the sampled URLs, so every figure in this study is a lab measurement.
Timeline
- Baseline A lower public performance baseline was recorded for the homepage, but the original before report was not archived, which is disclosed throughout.
- Measurement Four representative URLs were sampled with three mobile and three desktop PageSpeed runs each, reported by device with medians.
- Local verification Five cold and five warm mobile Chrome runs were completed for the homepage to characterise run-to-run variance.
- Current report Strong desktop results and resolved homepage layout stability are reported alongside unresolved mobile product LCP and COD hub layout shift.
The four numbers that matter, stated by device
Desktop and mobile were measured separately on all four URLs, and the two results are different enough that reporting them together would be misleading.
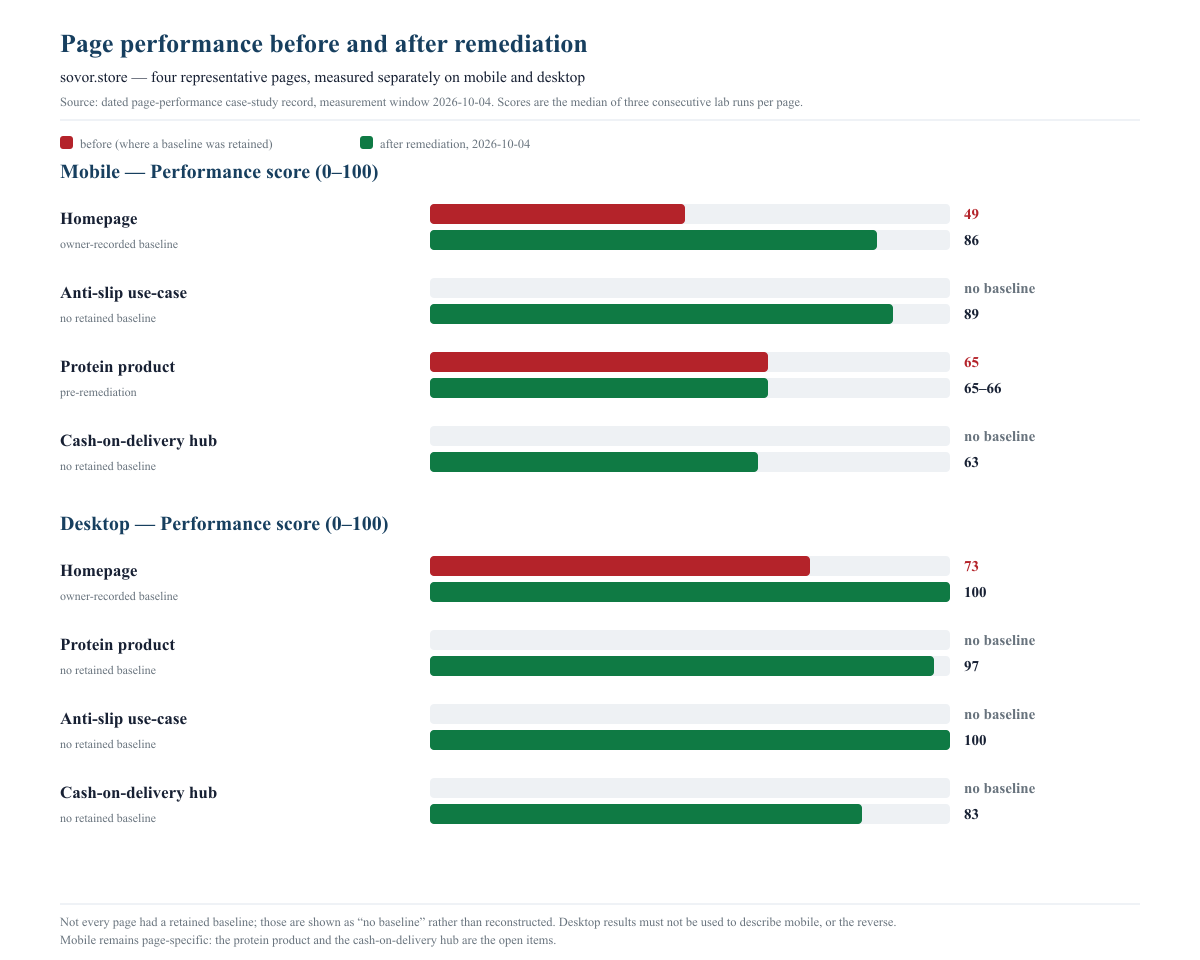
On desktop, the homepage reached 100, the anti-skid use-case page reached 100, the protein product page reached 97, and the COD hub reached 83. Three of four sampled commercial and content surfaces sit at or near the top of the scale. The COD hub is the exception, and its limitation is layout stability rather than load speed: its desktop LCP was 0.6 seconds, which is fast, but its CLS measured 0.337, meaning the page visibly moves as it loads.
On mobile, the same four URLs scored 86, 89, 65 and 63. The homepage and the anti-skid page are strong. The protein product page and the COD hub are not, and they are not in the same way. The product page’s problem is load time: its mobile LCP measured around 10.1 seconds, roughly four times the threshold usually treated as acceptable. The COD hub’s problem is again layout stability, with mobile CLS around 0.529.
The headline a store owner would want is ‘the site is fast’. The measurement says something narrower and more useful: on desktop, three of four sampled surfaces are excellent; on mobile, two of four are, and the two that are not fail for different reasons that need different fixes.
The homepage story is about layout, not speed
The homepage’s headline improvement is layout stability rather than raw speed, and that distinction is worth being precise about.
Its mobile CLS is now 0.000 in the repeated run set. The homepage previously moved as it loaded: content shifted after first paint, which is the experience where a reader starts to tap something and the page moves underneath them. That mechanism was addressed, and it is now effectively gone in the measured runs. Its desktop score reached 100 with an LCP of 0.6 seconds.
The homepage mobile LCP, however, measured 3.8 seconds, which is above the 2.5-second threshold usually treated as good. So the honest description of the homepage is that it is fast on desktop, stable on mobile, and still slower to paint on mobile than it should be. Layout stability and load speed are separate measurements, and improving one did not automatically improve the other.
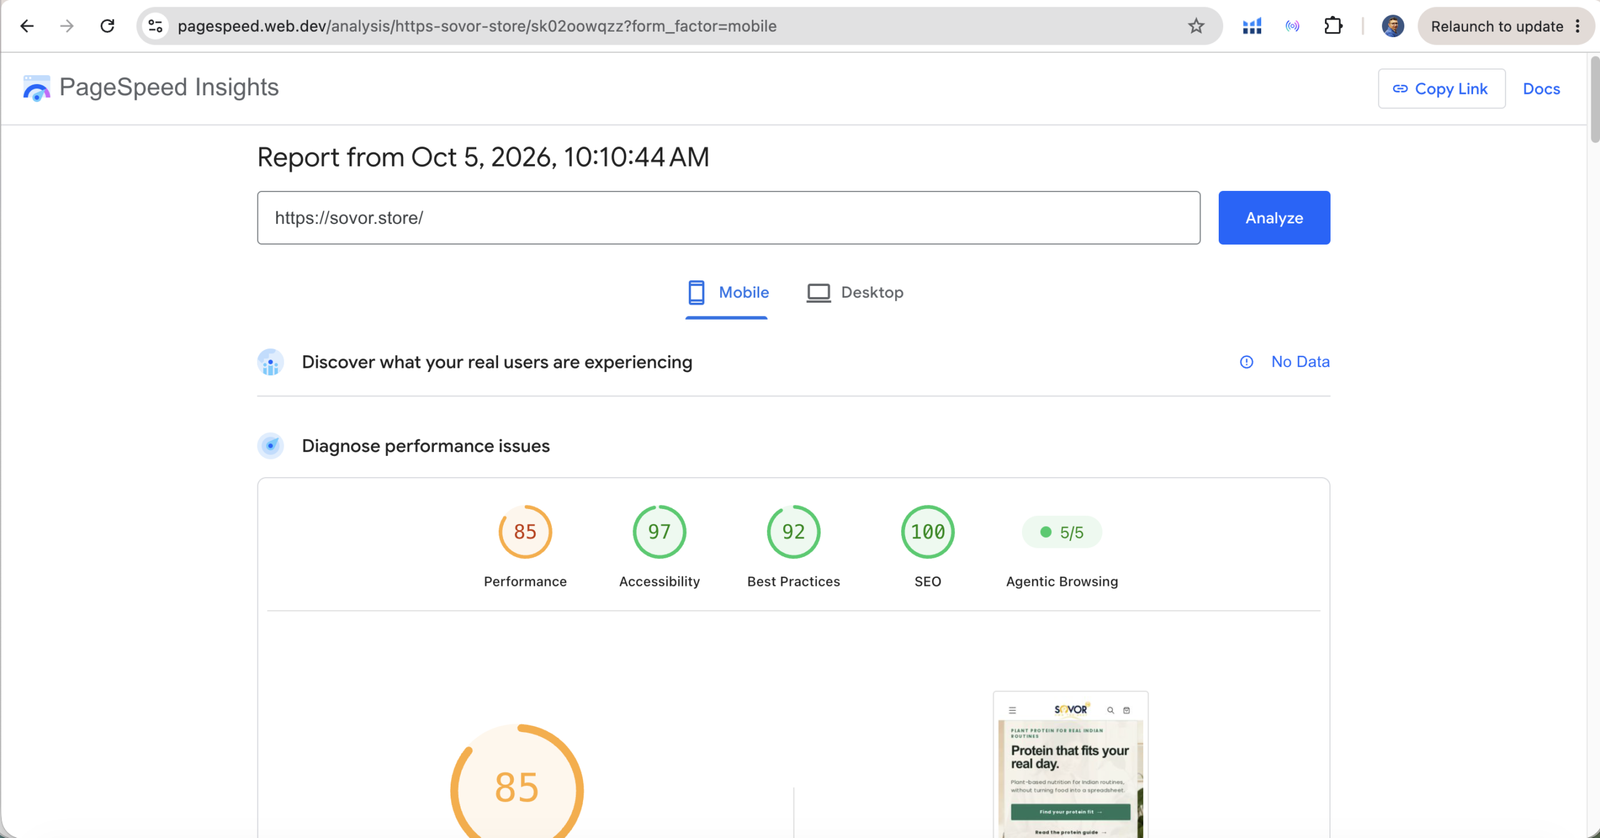
The mobile performance score moved from an owner-recorded baseline of 49 to a measured 85 to 86 across the run set. That is a large move on the recorded figures, and it is reported with the provenance caveat attached: the 49 was recorded before the work and its original report was not archived.
Where mobile is genuinely slow, and why the score hides it
The protein product page is the clearest remaining problem. It scored 65 on mobile against 97 on desktop, with a mobile LCP around 10.1 seconds. That is not a marginal miss. A ten-second load on a product page is long enough that a shopper may leave before seeing the product at all.
One contributing factor was measurable and was addressed: a body image on the product page was requesting roughly 6.57 megabytes without a width transform or stable dimensions. That image opportunity was reduced from approximately 706 kilobytes to 249 kilobytes. The product page’s performance score, however, moved only from 65 to 66.
That gap between the size reduction and the score movement is the most instructive detail in this study. It shows that reducing image weight, on its own, was not enough to move the number — because the bottleneck on that page is when the largest image is requested and how long it takes to arrive, not merely how large it is. Fixing the request path matters more than compressing the file.
The COD hub is a different problem again. Its mobile CLS measured around 0.529 across runs, with two distinct layout shifts detected. The hub had recently been expanded with a substantial internal link block, and the honest position is that it needs its own mobile layout pass before it can be presented as resolved.
Repeated runs, because one result is not a measurement
Every URL was measured three times per device and the median reported. That is not pedantry. The local Chrome cold-run set for the homepage showed an LCP range from 0.51 seconds to 6.31 seconds across five runs, and two runs recorded CLS around 0.412 where the median was 0.000.
That spread means a single run can produce almost any result you want, depending on luck. Reporting a best run would have produced a flattering number that no real visitor reliably experiences. Reporting the median is the only figure that describes what the page typically does.
The cold and warm comparison is also worth stating because it separates two different questions. Cold runs, starting with an empty cache, are closer to a first-time visitor and are visibly variable. Warm runs, with assets cached, were stable at an LCP of around 1.25 seconds and a CLS of 0.000. That difference tells you the homepage’s remaining speed problem is largely about what has to be fetched, not about what happens after it arrives.
What the evidence supports, and what it does not
The evidence supports a specific set of claims. Desktop lab performance reached 97 to 100 on three of four sampled URLs. Homepage layout stability reached effectively zero in the repeated run set. The work identified and fixed a large, measured image opportunity on the product page and reduced a known layout-shift mechanism on the homepage. The same work made the remaining mobile bottlenecks visible rather than hiding them behind an aggregate.
The evidence does not support the claim that the whole site is fast, and this study does not make it. Two of four sampled URLs score in the 60s on mobile. It does not support a claim that rankings, conversion or revenue improved. It does not support the claim that the site is faster on mobile as a universal statement, because two sampled mobile pages are slow and one of them is the product page.
No field data was available for these URLs, so nothing here describes the experience of real visitors on real devices with real network conditions. These are lab measurements, and lab measurements are a model, not the thing itself.
The baseline that was not saved
The homepage’s before values — desktop 73, mobile 49, mobile LCP 5.2 seconds — were recorded before the remediation work, but the original PageSpeed report or raw JSON was not archived. They are the store owner’s recorded measurements, not independently reproducible artefacts.
That does not make them false. It does mean the study labels them as recorded rather than verified, and explains why. A reader can see the after values reproduced in the dated run set. The before values rest on a record rather than an artefact, and the difference is disclosed rather than blurred.
This is now the standing rule for this kind of work: archive the report URL or raw output, the exact URL, the strategy, the date, the device emulation and the test count at the moment of measurement. A case study is only as strong as the provenance of its baseline, and provenance is cheapest to capture at the time and cannot be recovered afterwards.
What Improved
- Desktop and mobile are reported separately, so a strong desktop result cannot be used to describe a weaker mobile experience.
- The strongest sampled surfaces reached 97 to 100 on desktop with homepage layout stability reduced to effectively zero in the repeated run set.
- A measured product image opportunity was reduced from roughly 706 KiB to 249 KiB, and the record is honest that the page score barely moved as a result.
- Repeated runs and medians replace single-run reporting, which removes the most common way performance studies mislead.
- The remaining mobile bottlenecks are now visible and prioritised rather than concealed behind one aggregate score.
What Remains Unresolved
- Field or CrUX data was unavailable for the sampled URLs, so all figures are lab measurements.
- Mobile LCP and layout stability remain page-specific risks; two of four sampled URLs score in the 60s on mobile.
- The original before screenshot and raw report were not saved, so the baseline is labelled as recorded rather than verified.
- The study does not prove a ranking, conversion, sales, or revenue effect.
- Results are reported as medians of repeated runs, which describes typical behaviour rather than a best case.
Evidence Images
The original before screenshot was not saved. The before values are retained from the measurement record and disclosed as an unsaved-image limitation rather than presented with a fabricated or reconstructed image.
Next Decision
Decide whether the next performance sprint should prioritise the product page’s mobile LCP request path, the COD hub’s mobile layout stability, or a 28-day field-data collection to replace lab estimates with real-user measurement.
- SOVOR PageSpeed Insights runs, four URLs, mobile and desktop first-party lab measurement, three runs per device; 2026-10-04
- SOVOR homepage local Chrome cold and warm run set first-party lab measurement, five runs per mode; 2026-10-05
- SOVOR owner-recorded pre-remediation baseline recorded historical measurement, original report not archived; 2026-10-04
Case study library | GSA case studies | Free website SEO audit
See which pages lose clicks
Run the free website SEO audit to find the pages Google already shows but that earn almost no clicks, then fix the highest-impact issues first.