

Google Search Console becomes useful when the numbers lead to a specific question. It becomes confusing when every number is treated as a verdict about the website.
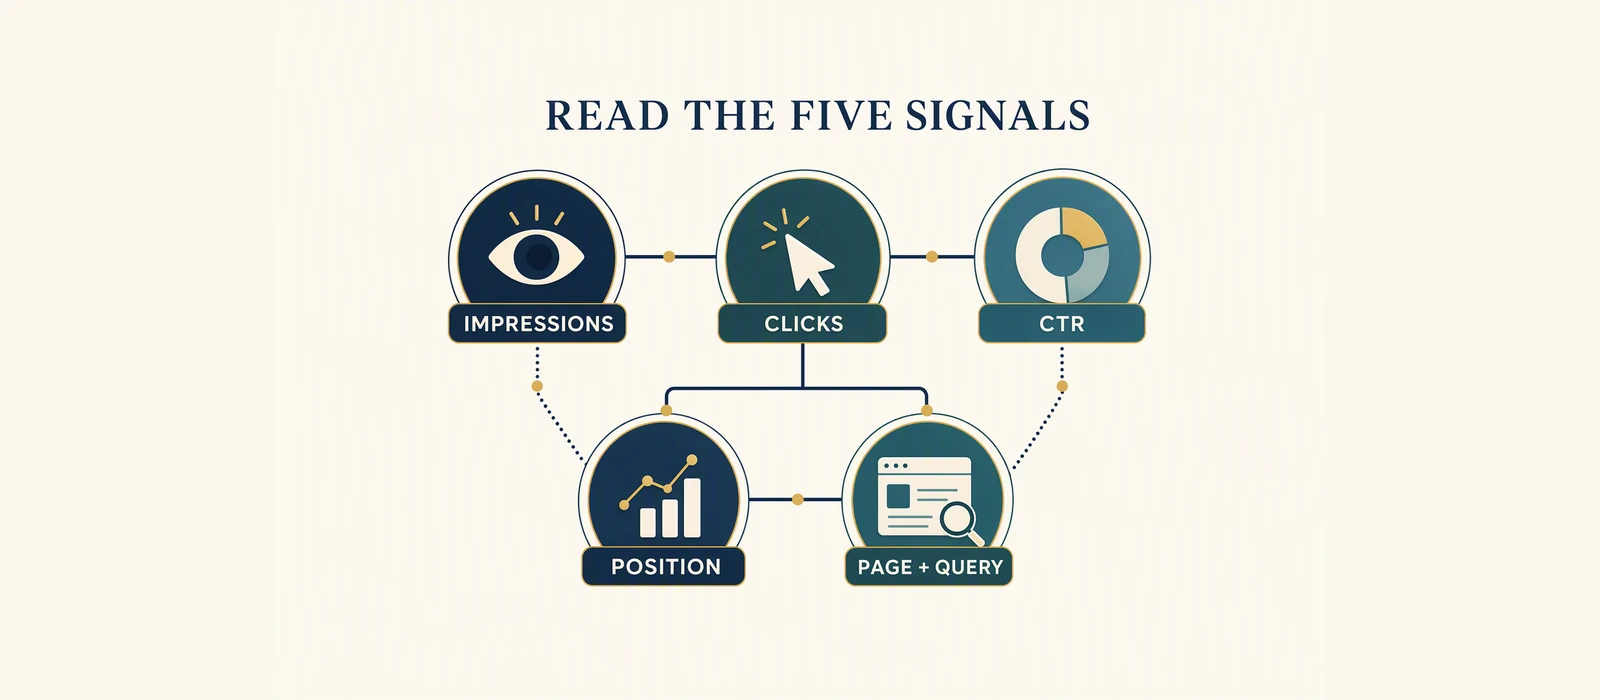
Read five ideas: impressions, clicks, CTR, average position, and the page/query relationship.
Direct answer
- Impressions are recorded search appearances.
- Clicks are recorded selections from those appearances.
- CTR is clicks divided by impressions, multiplied by 100.
- Average position is an aggregated observation of where impressions were recorded in the selected data.
- Page/query relationship connects the URL that appeared with the wording and intent behind the search.
Together, these observations describe visibility and selection in a chosen report window. They do not, by themselves, prove rankings, leads, sales, or revenue.
1. Impressions: was the page shown?
An impression means Search Console recorded an appearance for a site, page, or query in the selected period. It is a visibility observation.
An impression does not mean a person read the result. It does not mean the person understood the offer. It does not mean the person wanted to contact the business. A page can collect impressions for queries that are broad, incidental, or only partly aligned with its actual purpose.
Use impressions to ask: Where is Google associating this page or site with a search? Then open the query and page views to understand that association.
2. Clicks: was the result selected?
A click means a searcher selected the result recorded in Search Console. It is closer to a visit than an impression, but it is still not a business outcome.
A click does not prove that the visitor stayed, read the page, filled in a form, called, booked, or purchased. Those actions need their own measurement. This is why a Search Console report and an analytics or CRM report should not be collapsed into one number.
Use clicks to ask: Is recorded visibility becoming a visit? If clicks are missing, compare the result promise with the query and page. If business actions are missing, inspect the page and measurement path separately.
3. CTR: what proportion of appearances became clicks?
CTR joins impressions and clicks in one ratio:
CTR = clicks / impressions x 100The denominator matters. A CTR without its impression total can sound more significant than it is. A click total without its impression total cannot tell you how often the result was selected.
CTR is useful for examining selection in a defined grouping and date window. It is not a universal quality score. It can change because the click count changes, the impression count changes, or the query mix changes. A lower percentage needs the numerator, denominator, page, query, and date range beside it.
4. Average position: what does the summary describe?
Average position summarises where impressions were recorded across the selected data. It is an average observation, not a fixed rank. Search results can vary by query, device, location, timing, and other context.
That means an average position should not be read as “every searcher saw this page at this exact position.” It can combine a page’s appearances across different queries. A page-level average can also hide the fact that one relevant query and one incidental query behaved differently.
Use average position to ask: What kind of result-set visibility was recorded in this grouping, and should I narrow the view to a specific query or page? Do not use it as a promise about what any individual searcher will see.
5. Page and query: what answer was connected to what question?
The page is the URL Google recorded. The query is the search wording connected to that appearance. The relationship is often more informative than either item alone.
If the query asks for a comparison and the page is a service page, selection may reflect an intent mismatch. If several URLs appear for a service query, the issue may be page ownership.
The keyword-to-page action plan uses one primary intent per page. That does not mean a page can appear for only one phrase. It means the owner should know which customer problem the page is designed to answer and avoid creating competing pages for the same purpose.
Worked illustrative example
Worked illustrative example – anonymised GSA Growth demonstration. This is an observed report row used for explanation. It is not a benchmark, forecast, or guarantee.
The row contains 4,200 impressions, 12 clicks, 0.29% CTR, and average position 8.4. The CTR calculation is:
12 / 4,200 x 100 = approximately 0.29%Read the row in layers. Impressions show recorded visibility. Clicks show recorded selections. CTR shows the relationship between them. Average position gives a grouped visibility summary. The page and query tell you what the row is actually about.
The row supports a review question: why were the recorded selections small compared with the recorded appearances? It does not answer that question. You still need to inspect the query mix, result wording, page promise, and report scope.
The date range belongs beside the metrics. A value without its window is difficult to compare fairly.
A simple reading workflow
Lock the scope
Choose the correct Search Console property and record the date range. If comparing periods, use comparable windows and write down whether you are looking at the site, a page, or a query.
Record the four metrics
Write down impressions, clicks, CTR, and average position. Keep the values together. Do not copy a percentage without the clicks and impressions that produced it.
Move from Pages to Queries
Use the page view to find the URL, then the query view to see what searches were associated with it. If the view is too broad, narrow it before making a decision.
Choose one question
Examples include: Is the page visible but under-selected? Is the query relevant to the page? Is the average hiding several contexts? Is a business-action measurement missing?
Keep the next action proportional
A report row may justify a title review, a page review, an ownership check, a technical investigation, or no immediate change. It does not automatically justify a sitewide rewrite.
What the data does not prove
These five ideas do not prove that a page has a guaranteed rank, that a specific edit will increase traffic, or that a click will become a lead or sale. They do not prove why a searcher did not select a result. They do not replace the page itself, analytics, call tracking, form tracking, or customer feedback.
They also do not prove market demand. The GSA keyword/action plan keeps Semrush, Google Ads, Autocomplete, Places, and GSC in separate evidence roles. GSC shows what Google recorded for the property, not total search volume.
Checklist
- [ ] Select the correct property.
- [ ] Record the date range and report grouping.
- [ ] Note impressions, clicks, CTR, and average position together.
- [ ] Confirm that the CTR denominator is visible.
- [ ] Move between Pages and Queries.
- [ ] Check whether the page and query share one intent.
- [ ] Inspect the rendered result and page.
- [ ] Write one next question, one possible action, and one limitation.
Optional next step
Use the free Website SEO Audit for a baseline. If you already have first-party Search Console history, review the Revenue-Leak Audit for page/query diagnosis.
For adjacent context, see the GSC audit case study.
Sources and Disclosure
This article uses dated consumer-facing evidence and clearly labelled teaching examples. Examples are directional, not forecasts or guarantees. No private client information, credentials or internal implementation details are included.
Dated guidance. No ranking, traffic or revenue guarantee.
Choose the next step
Compare the fixed-scope options or book a fit call.
See which pages lose clicks
Run the free website SEO audit to find the pages Google already shows but that earn almost no clicks, then fix the highest-impact issues first.